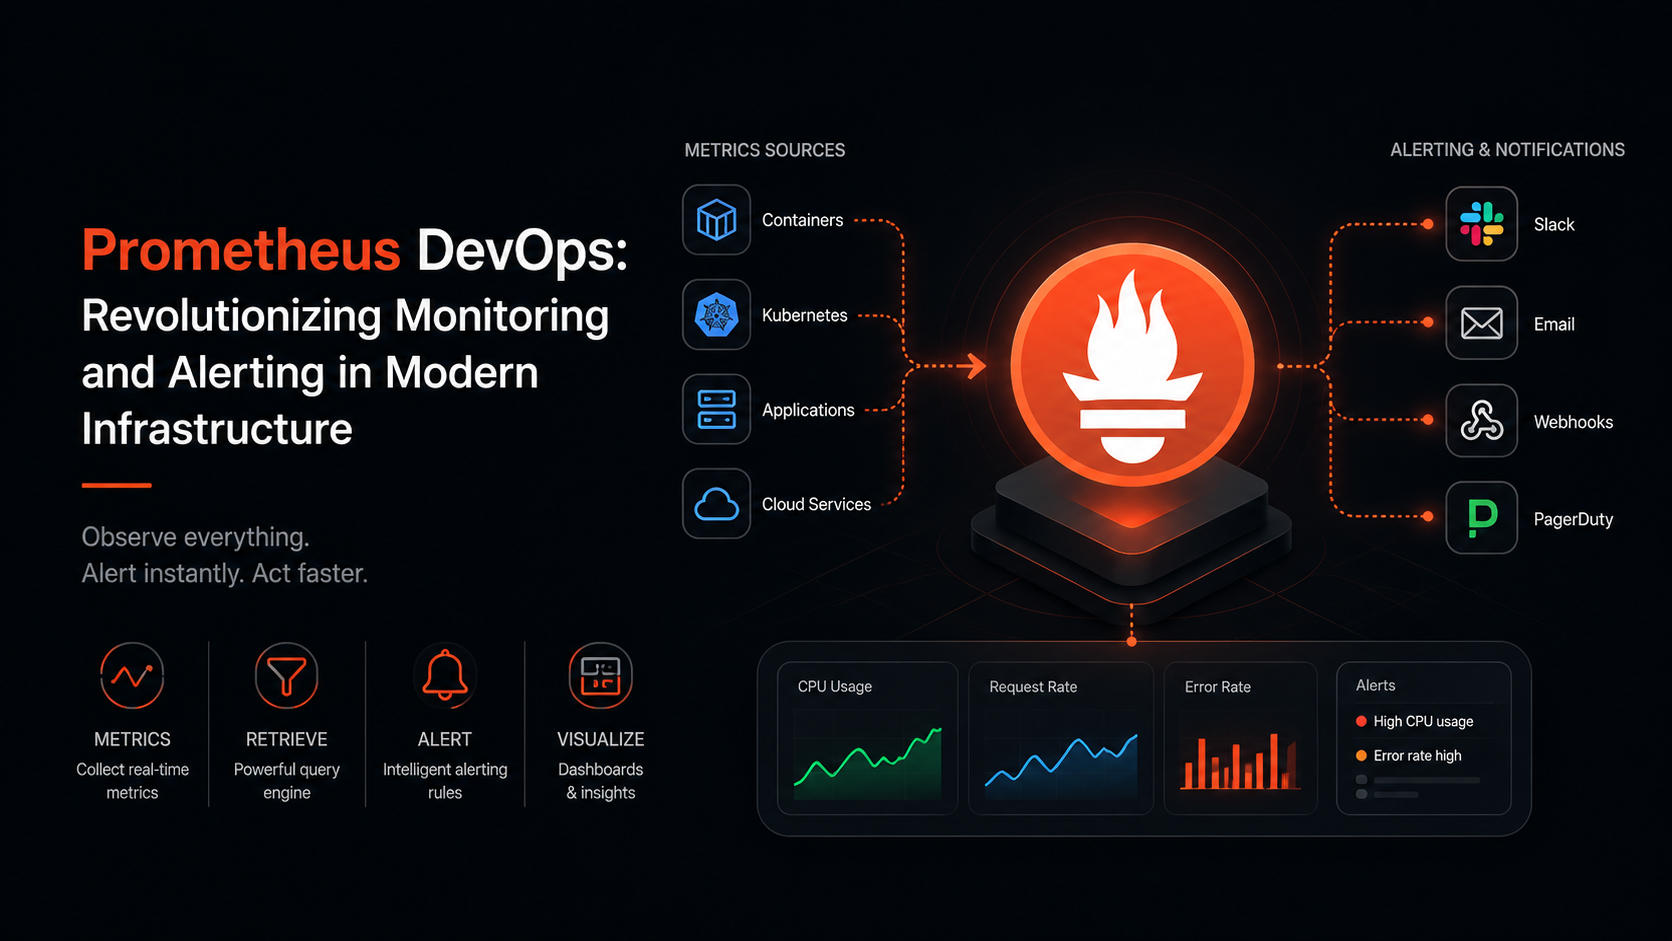
In the rapidly evolving world of DevOps, effective monitoring and alerting are critical for maintaining seamless operations and ensuring system reliability. Prometheus, an open-source monitoring tool, has emerged as a game-changer in this domain. Designed for scalability and flexibility, Prometheus empowers DevOps teams to monitor their infrastructure effectively and respond to issues proactively.
What is Prometheus in DevOps?
Prometheus is an open-source systems monitoring and alerting toolkit originally developed by SoundCloud. It has since become one of the most popular tools in the DevOps ecosystem, thanks to its robust feature set and active community support.
Key Features of Prometheus
- Time-Series Data Storage: Prometheus stores metrics as time-series data, allowing teams to analyze performance trends over time.
- Powerful Query Language (PromQL): Prometheus Query Language (PromQL) enables users to create complex queries to extract meaningful insights from their metrics.
- Flexible Alerting Mechanism: Prometheus supports flexible and customizable alerting, enabling teams to define rules that trigger alerts based on specific conditions.
- Service Discovery: With built-in service discovery, Prometheus automatically detects and monitors services in dynamic environments like Kubernetes.
Why Prometheus is Essential for DevOps
Prometheus is not just another monitoring tool; it’s a cornerstone of modern DevOps practices. Here's why:
Scalability for Modern Infrastructure
In today's world of microservices and containerized environments, scalability is crucial. Prometheus can handle massive workloads by sharding data across multiple nodes. This makes it ideal for cloud-native applications running on platforms like Kubernetes and Docker.
Enhanced System Reliability
With Prometheus, DevOps teams can proactively identify and address system bottlenecks before they impact users. Its real-time monitoring capabilities ensure system reliability, helping organizations maintain high availability.
Comprehensive Ecosystem and Integrations
Prometheus integrates seamlessly with a wide array of tools in the DevOps ecosystem, such as Grafana for visualization, Alertmanager for alert management, and many third-party exporters that allow monitoring of various services and applications.
Prometheus Architecture: A Closer Look
Prometheus is designed around a pull-based architecture, meaning it actively scrapes metrics from configured targets. This architecture includes several core components:
Prometheus Server
The central component that scrapes and stores metrics, executes PromQL queries, and manages time-series data.
Exporters
Exporters collect metrics from external systems and expose them in a Prometheus-compatible format. Examples include Node Exporter for hardware metrics and cAdvisor for container metrics.
Alertmanager
Handles alerts generated by Prometheus, providing features like grouping, routing, and silencing to streamline alert management.
Pushgateway
Allows short-lived jobs to push their metrics to Prometheus, ensuring even ephemeral data is captured.
Prometheus and Grafana: A Perfect Pair
While Prometheus excels at monitoring and alerting, Grafana complements it with powerful data visualization capabilities. Together, they provide a holistic view of system health.
Benefits of Integrating Prometheus with Grafana
- Custom Dashboards: Create interactive dashboards tailored to your specific needs.
- Data Correlation: Visualize metrics from multiple data sources in one place.
- Enhanced Insights: Spot trends, anomalies, and correlations with ease.
Prometheus in Cloud and Containerized Environments
Prometheus is built to thrive in dynamic, cloud-native environments. Its ability to discover services automatically and monitor ephemeral resources like containers makes it indispensable for teams using:
- Kubernetes: Prometheus integrates tightly with Kubernetes, monitoring pods, nodes, and other resources.
- Docker: Track container performance and resource usage with ease.
- AWS, GCP, Azure: Use Prometheus to monitor cloud infrastructure across various platforms.
How to Implement Prometheus in Your DevOps Workflow
Implementing Prometheus involves a few key steps to ensure optimal performance:
Step 1: Install Prometheus
Prometheus can be installed on most operating systems, or deployed as a Docker container for easy setup.
Step 2: Configure Service Discovery
Set up service discovery to automatically scrape metrics from your services.
Step 3: Define Alerting Rules
Configure alerting rules to notify your team when performance thresholds are breached.
Step 4: Integrate with Grafana
Use Grafana for data visualization and build insightful dashboards.
Best Practices for Using Prometheus in DevOps
To get the most out of Prometheus, follow these best practices:
- Set Up Meaningful Alerts: Avoid alert fatigue by defining specific, actionable alert rules.
- Optimize Data Retention: Balance historical data retention with storage efficiency.
- Regularly Update and Maintain: Keep Prometheus and its exporters up-to-date to leverage new features and improvements.
- Use Labels Effectively: Labels are key to filtering and aggregating data; use them consistently for better queries.
Prometheus has redefined how DevOps teams approach monitoring and alerting. Its flexibility, scalability, and rich feature set make it a top choice for organizations aiming to ensure system reliability and efficiency in modern infrastructures. Whether you're operating in the cloud, leveraging containers, or managing legacy systems, Prometheus provides the tools you need to monitor and optimize your environment effectively.